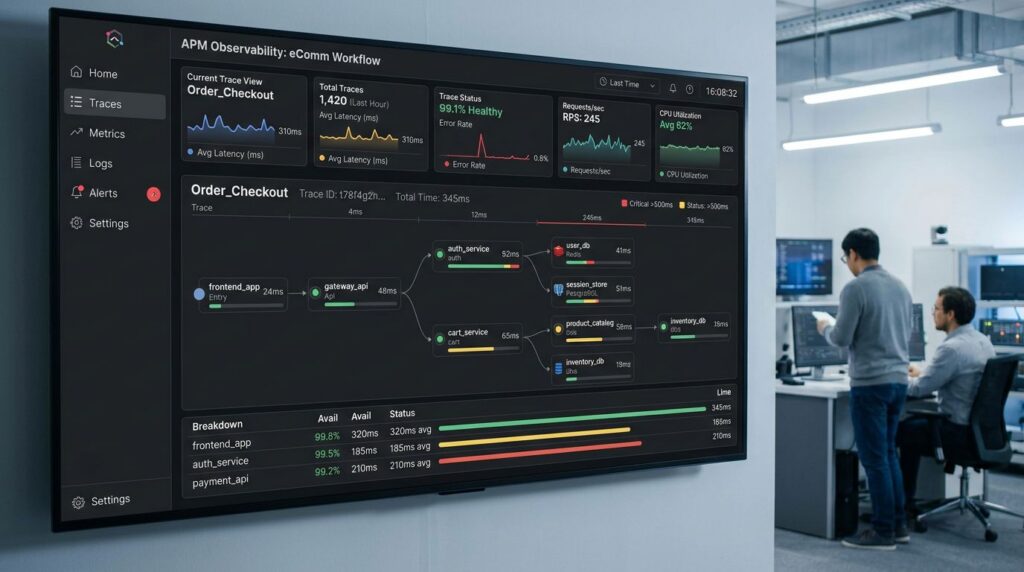
## Introduction to Observability in n8n
Observability in production automation has evolved from being an optional feature to a critical necessity. With native OpenTelemetry integration in n8n, it’s now possible to gain complete visibility into the behavior of complex workflows, identify bottlenecks, and diagnose failures with surgical precision.
This tutorial will guide you step-by-step to implement complete instrumentation using n8n OpenTelemetry, from initial configuration to advanced production monitoring techniques.
## Initial OpenTelemetry Configuration in n8n
### Installation and Basic Setup
To enable OpenTelemetry in your n8n instance, you need to configure the appropriate environment variables:
“`bash
# Basic OpenTelemetry variables
N8N_OTEL_ENABLED=true
OTEL_SERVICE_NAME=n8n-production
OTEL_SERVICE_VERSION=1.0.0
OTEL_ENVIRONMENT=production
# OTLP exporter configuration
OTEL_EXPORTER_OTLP_ENDPOINT=http://jaeger:14268/api/traces
OTEL_EXPORTER_OTLP_HEADERS=”api-key=your-api-key”
“`
### Advanced Sampling Configuration
For high-volume production environments, configure sampling to control the amount of traces:
“`bash
# 5% probabilistic sampling
OTEL_TRACES_SAMPLER=probabilistic
OTEL_TRACES_SAMPLER_ARG=0.05
# Rate limiting sampling (100 traces per second)
OTEL_TRACES_SAMPLER=rate_limiting
OTEL_TRACES_SAMPLER_ARG=100
“`
## Workflow and Node Instrumentation
### Automatic Traces per Execution
n8n automatically generates spans for each workflow execution and individual node. Each span includes:
– **Workflow span**: Total execution duration
– **Node spans**: Processing time per node
– **HTTP spans**: External API calls
– **Database spans**: Database operations
### Adding Custom Context
You can enrich traces with specific metadata using the Code node:
“`javascript
// Add custom attributes to the current span
const { trace } = require(‘@opentelemetry/api’);
const span = trace.getActiveSpan();
if (span) {
span.setAttributes({
‘workflow.customer_id’: $json.customer_id,
‘workflow.order_value’: $json.total_amount,
‘workflow.processing_type’: ‘batch’
});
}
return $input.all();
“`
### Custom HTTP Node Instrumentation
For HTTP nodes making critical calls, add specific instrumentation:
“`javascript
// In a Code node before HTTP Request
const { trace } = require(‘@opentelemetry/api’);
const tracer = trace.getTracer(‘n8n-custom’);
const span = tracer.startSpan(‘api.payment.process’, {
attributes: {
‘http.method’: ‘POST’,
‘http.url’: ‘https://api.payment.com/process’,
‘payment.amount’: $json.amount,
‘payment.currency’: $json.currency
}
});
// The span will close automatically after the HTTP node
return $input.all();
“`
## Performance Metrics Monitoring
### Custom Metrics Configuration
n8n OpenTelemetry can export metrics in addition to traces:
“`bash
# Enable metrics export
N8N_OTEL_METRICS_ENABLED=true
OTEL_EXPORTER_METRICS_ENDPOINT=http://prometheus:9090/api/v1/write
“`
### Key Metrics to Monitor
These are the most important metrics you should track:
1. **Node latency**: Average execution time
2. **Workflow throughput**: Executions per minute
3. **Error rate**: Failure percentage by type
4. **Queue depth**: Pending jobs in queue
5. **Resource utilization**: CPU and memory per workflow
### SLO-Based Alerts
Configure proactive alerts based on Service Level Objectives:
“`yaml
# Prometheus configuration example
groups:
– name: n8n.slos
rules:
– alert: WorkflowLatencyHigh
expr: histogram_quantile(0.95, n8n_workflow_duration_seconds) > 30
for: 5m
labels:
severity: warning
annotations:
summary: “Workflow latency P95 above 30s”
– alert: WorkflowErrorRateHigh
expr: rate(n8n_workflow_errors_total[5m]) > 0.05
for: 2m
labels:
severity: critical
“`
## Advanced Debugging with Distributed Traces
### Error Correlation
When a workflow fails, OpenTelemetry allows you to trace the exact error:
“`javascript
// Error handling with trace context
try {
// Node logic
const result = await processData($json);
return result;
} catch (error) {
const { trace } = require(‘@opentelemetry/api’);
const span = trace.getActiveSpan();
if (span) {
span.recordException(error);
span.setStatus({
code: trace.SpanStatusCode.ERROR,
message: error.message
});
span.setAttributes({
‘error.type’: error.constructor.name,
‘error.input_data’: JSON.stringify($json)
});
}
throw error;
}
“`
### Dependency Analysis
Use the service map generated by traces to identify:
– **Critical services**: APIs with the highest latency impact
– **Failure points**: Services with high error rates
– **Bottlenecks**: Nodes that limit throughput
## Integration with Observability Tools
### Jaeger for Trace Analysis
Jaeger provides an excellent visual interface for analyzing traces:
“`yaml
# docker-compose.yml for Jaeger
version: ‘3.8’
services:
jaeger:
image: jaegertracing/all-in-one:latest
ports:
– “16686:16686”
– “14268:14268”
environment:
– COLLECTOR_OTLP_ENABLED=true
“`
### Grafana for Dashboards
Create specific dashboards for n8n workflows:
“`json
{
“dashboard”: {
“title”: “n8n Workflows Observability”,
“panels”: [
{
“title”: “Workflow Execution Rate”,
“targets”: [
{
“expr”: “rate(n8n_workflow_executions_total[5m])”
}
]
},
{
“title”: “Average Node Latency”,
“targets”: [
{
“expr”: “histogram_quantile(0.50, n8n_node_duration_seconds)”
}
]
}
]
}
}
“`
## Performance Optimization Based on Observability
### Bottleneck Identification
Use OpenTelemetry metrics to optimize workflows:
1. **Latency analysis**: Identify slow nodes
2. **Parallelization**: Optimize unnecessary sequential flows
3. **Caching**: Implement cache in nodes with repetitive data
4. **Batch processing**: Group similar operations
### Optimization Techniques
Based on observability data:
“`javascript
// Implement intelligent cache based on metrics
const cacheKey = `api_${$json.endpoint}_${$json.params}`;
const cachedResult = await $cache.get(cacheKey);
if (cachedResult && Date.now() – cachedResult.timestamp < 300000) {
// Cache hit - record metric
const { metrics } = require('@opentelemetry/api');
const meter = metrics.getMeter('n8n-cache');
const cacheHits = meter.createCounter('cache_hits_total');
cacheHits.add(1, { endpoint: $json.endpoint });
return cachedResult.data;
}
// Cache miss - continue with API call
```
## Production Best Practices
### Intelligent Sampling Configuration
Implement adaptive sampling based on conditions:
```bash
# Conditional sampling by criticality
OTEL_TRACES_SAMPLER=jaeger_remote
OTEL_TRACES_SAMPLER_ARG="endpoint=http://jaeger:14268/api/sampling"
```
### Resource Management
To avoid performance impact:
- **Batch export**: Group spans before sending
- **Async processing**: Process traces asynchronously
- **Resource limits**: Limit memory used by the SDK
- **Graceful degradation**: Disable tracing if there are issues
### Security and Compliance
Ensure instrumentation meets requirements:
```javascript
// Sanitize sensitive data in spans
const sanitizeAttributes = (data) => {
const sanitized = { …data };
delete sanitized.password;
delete sanitized.credit_card;
delete sanitized.ssn;
// Mask emails
if (sanitized.email) {
sanitized.email = sanitized.email.replace(/(.{2}).*@/, ‘$1***@’);
}
return sanitized;
};
span.setAttributes(sanitizeAttributes($json));
“`
To implement robust observability in your n8n automations, consider [[INTERNAL:microservices-architecture]] and explore our specialized [[INTERNAL:devops-solutions]].
## Conclusion
Implementing n8n OpenTelemetry radically transforms the ability to monitor and optimize production automations. With distributed traces, granular metrics, and contextual debugging, you can guarantee the reliability and performance of critical workflows.
The initial investment in instrumentation translates to significant reduction in incident resolution time, better understanding of system behavior, and proactive optimization capabilities.
Need to implement complete observability in your n8n automations? Our specialized team can help you design and implement a robust monitoring strategy. [Contact us](/contact/) for personalized consulting on enterprise automation observability.